Spanish electrical system
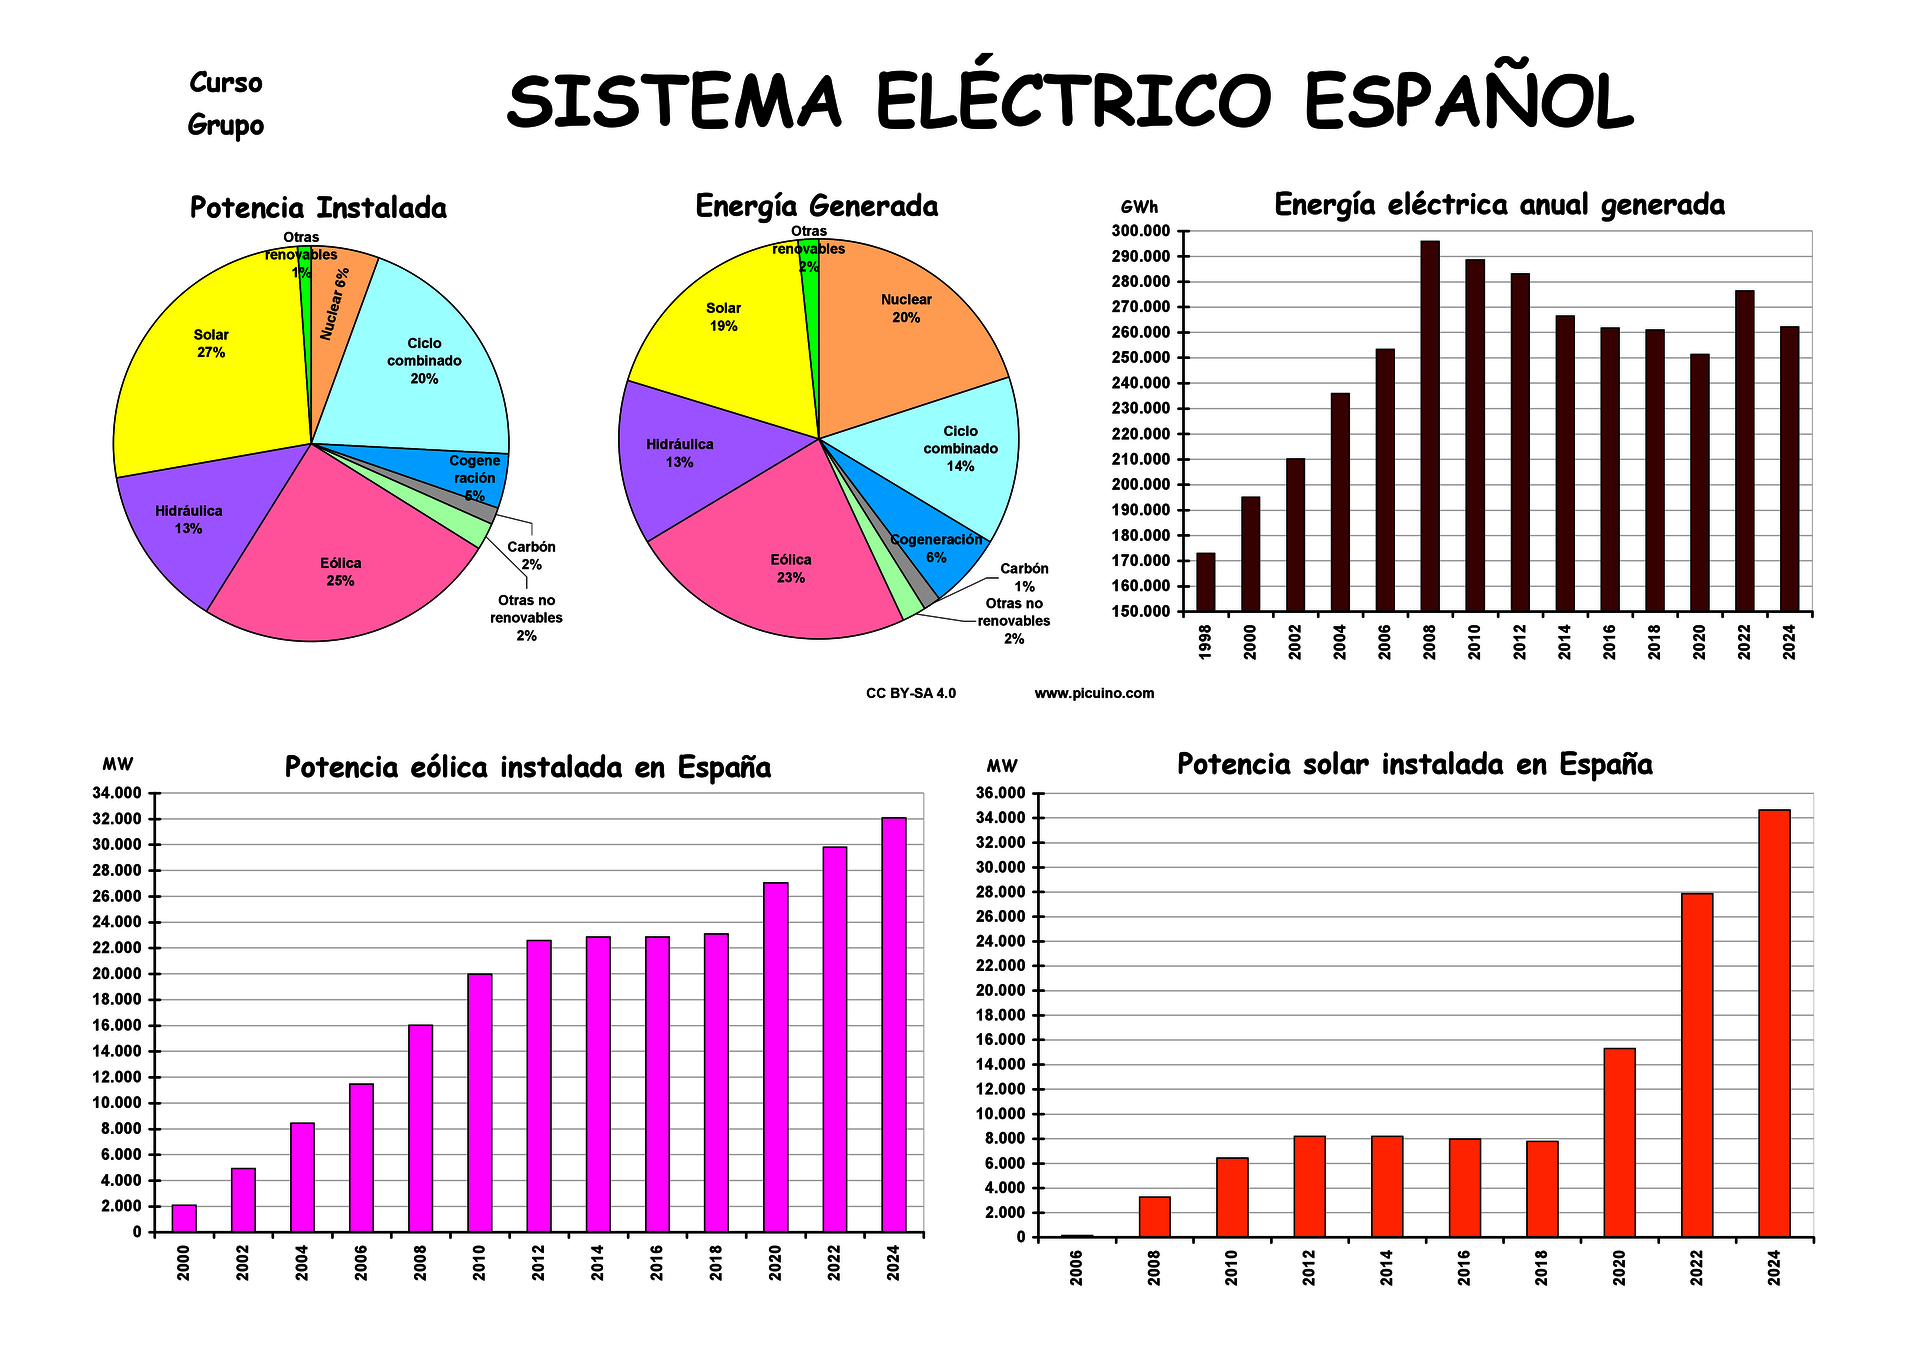
Mural of the Spanish electricity system until 2024. The mural contains graphs of installed power and generated power in 2024 in pie format. It also contains graphs of the evolution of electricity generation in recent years and the evolution of installed wind and solar power in bar chart format.
This mural is designed to be represented on a large cardboard, adapting the graphics as much as possible to the size of the cardboard so that there is not much free space between them.
The mural can also be made in spreadsheet format in the computer room from the spreadsheet with the data.
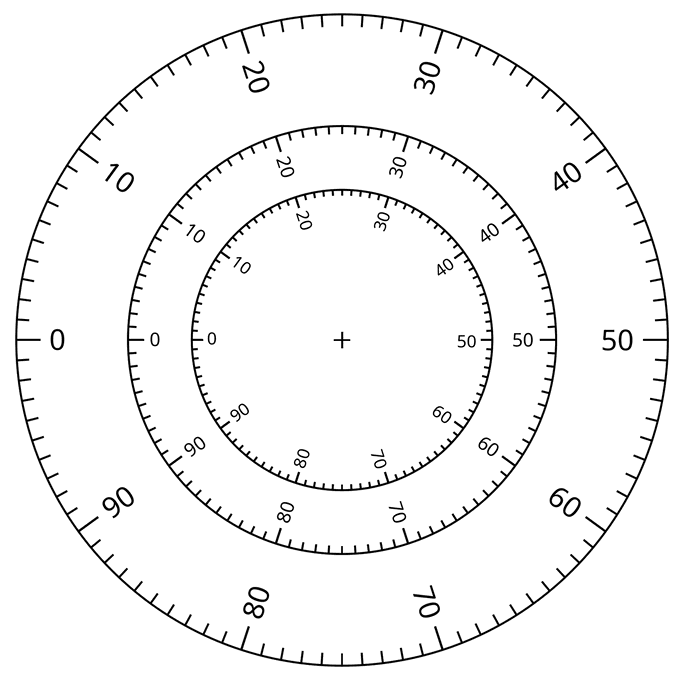
A template for making the pie charts is attached.
Exercises
Exercises on the Spanish electricity system.