Flowcharts
A flowchart is a drawing that represents a process made up of tasks and decisions. Its purpose is to express in a simple and visual way what happens in a process or in a program, so that it is easy to understand.
Flowcharts are drawn by a client at the beginning of a project so that the programmer better understands what to program. Programmers also draw flowcharts to document what a computer program does once it is finished, in a visual and understandable way.
Flowcharts are not limited to representing the operation of programs, they can also inform people of the tasks that we must perform in a given situation.
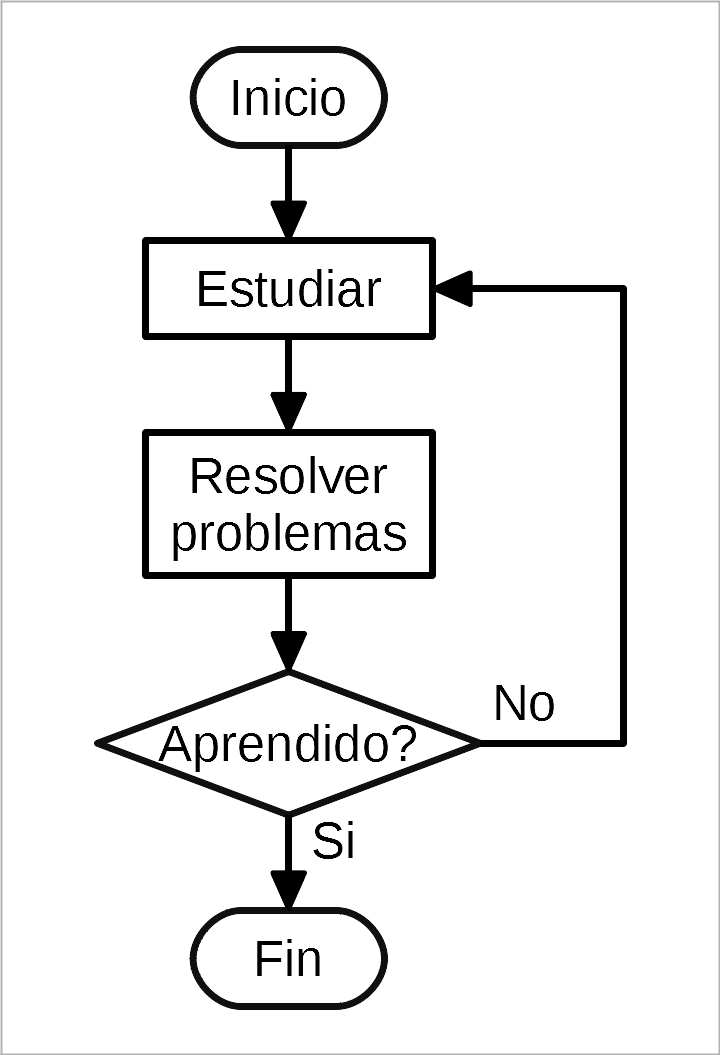
This is what a flowchart looks like:
Symbols
Below are the main symbols used to draw flowcharts.
- Beginning and end
All flowcharts must have a start symbol and an end symbol, which are represented by rounded rectangles at the ends.

Program start and end symbols.
- Tasks
The tasks performed by the program are represented with rectangles. Inside the rectangle you must write what the task consists of. For example, adding two numbers or sending a message.
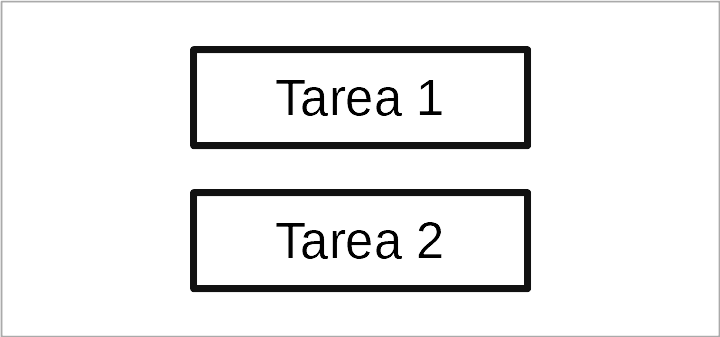
Task symbol.
- Data input and output
When the task consists of data input or output such as writing on the screen, asking the user to type text, printing a sheet of paper, etc. In that case the task will have the shape of an inclined rectangle.
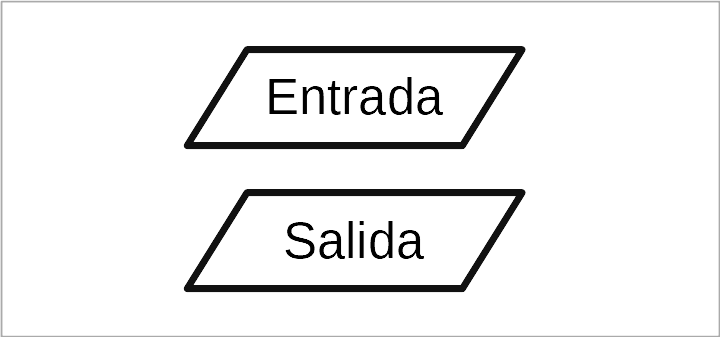
Entry and exit symbol.
- Decisions
A very special symbol is the decision symbol. With this symbol the program can follow two different paths, depending on whether the condition is met or not met.
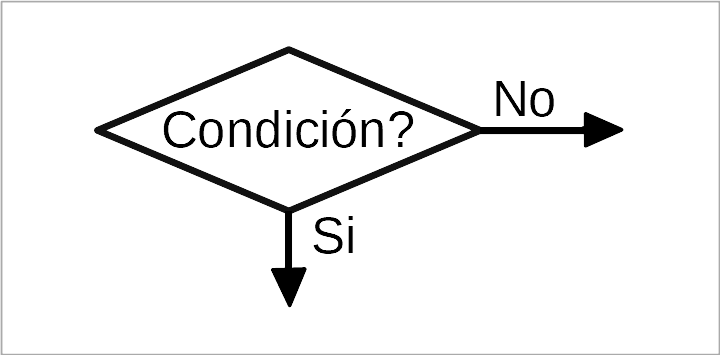
Decision symbol. Which way to go depends on the condition.
- Flow arrows
All symbols must be linked together by arrows that indicate how the sequence is carried out. The arrows indicate the path or flow that the computer follows from the beginning to the end of the program, through all the tasks.
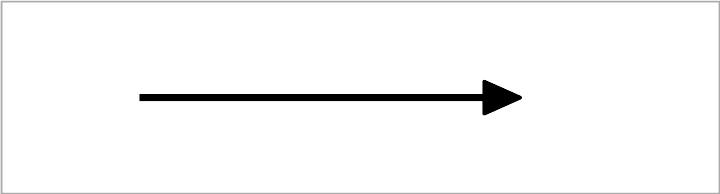
Arrow connecting tasks.
- Arrow connectors
When the two tasks to be joined are too far away or when it is confusing to cross many arrows, then two circles with the same number are used to indicate the beginning and the end of the arrow.
Each arrow must have a different number, so there must be only 2 circles with the same number. A beginning circle and an ending circle.
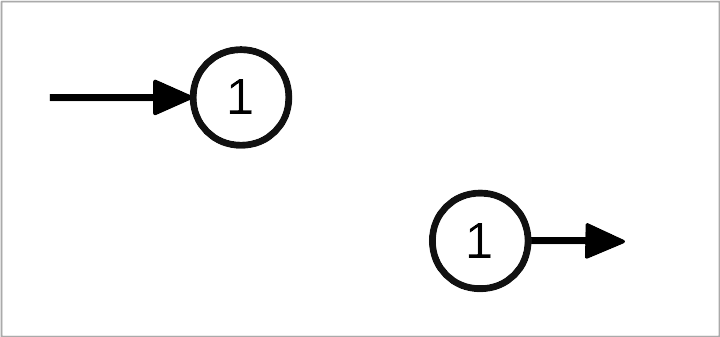
Long arrow, separated by circular connectors.
- Other symbols
- So far we have seen the most important symbols. With them you can represent all the diagrams with which we are going to work. There are also other specialized symbols that allow you to represent tasks in more detail, but using them would only make the diagrams more complicated, so we won't use them.
Example diagrams
- Sequential diagram
In this diagram the tasks follow one another, without any decision. This type of diagram is useful for knowing the order in which a task must be performed.
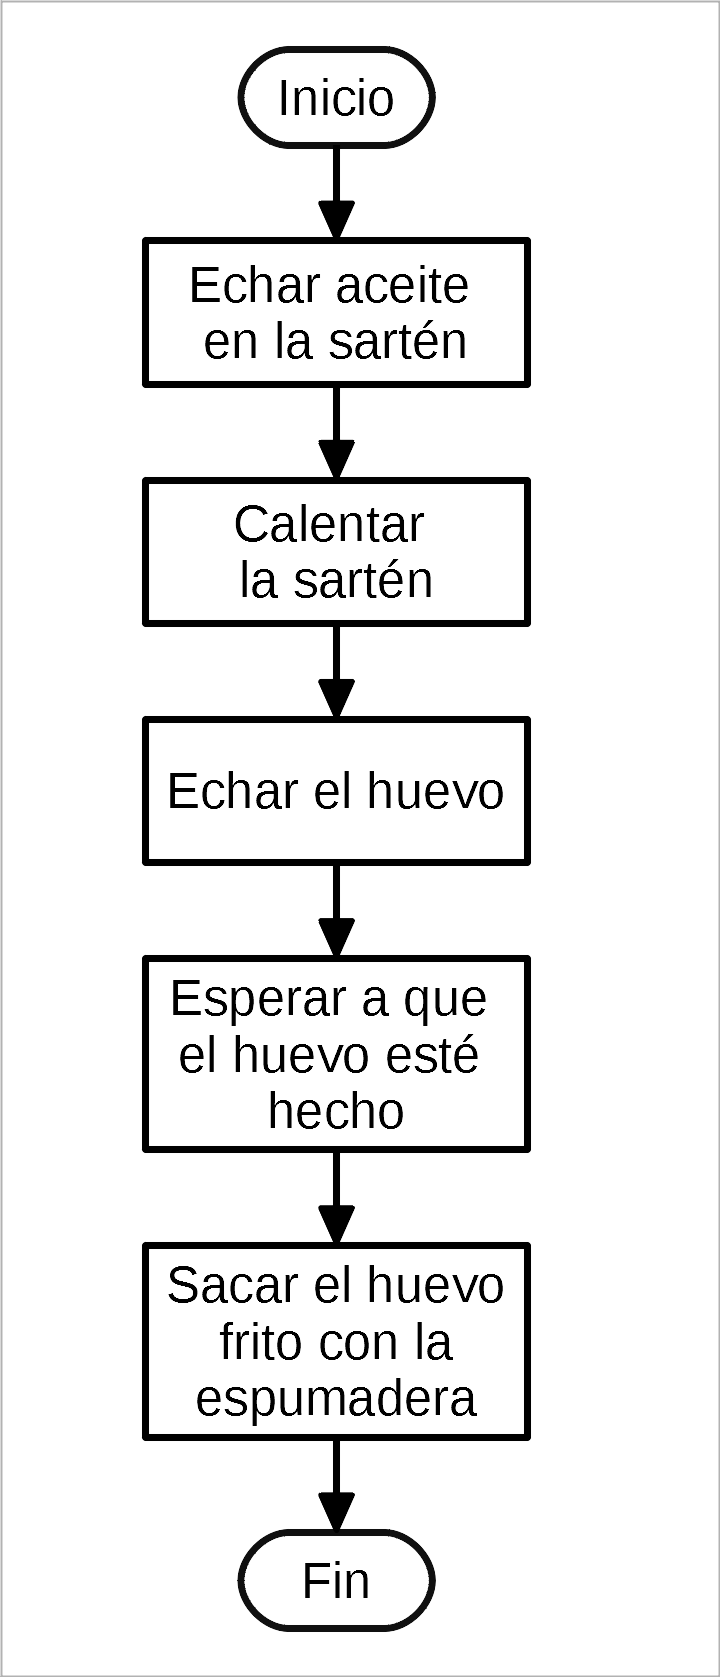
Flowchart describing how to make a fried egg.
- Conditional diagram
In this type of diagram, the task flow is not sequential and deviates depending on the conditions that are met.
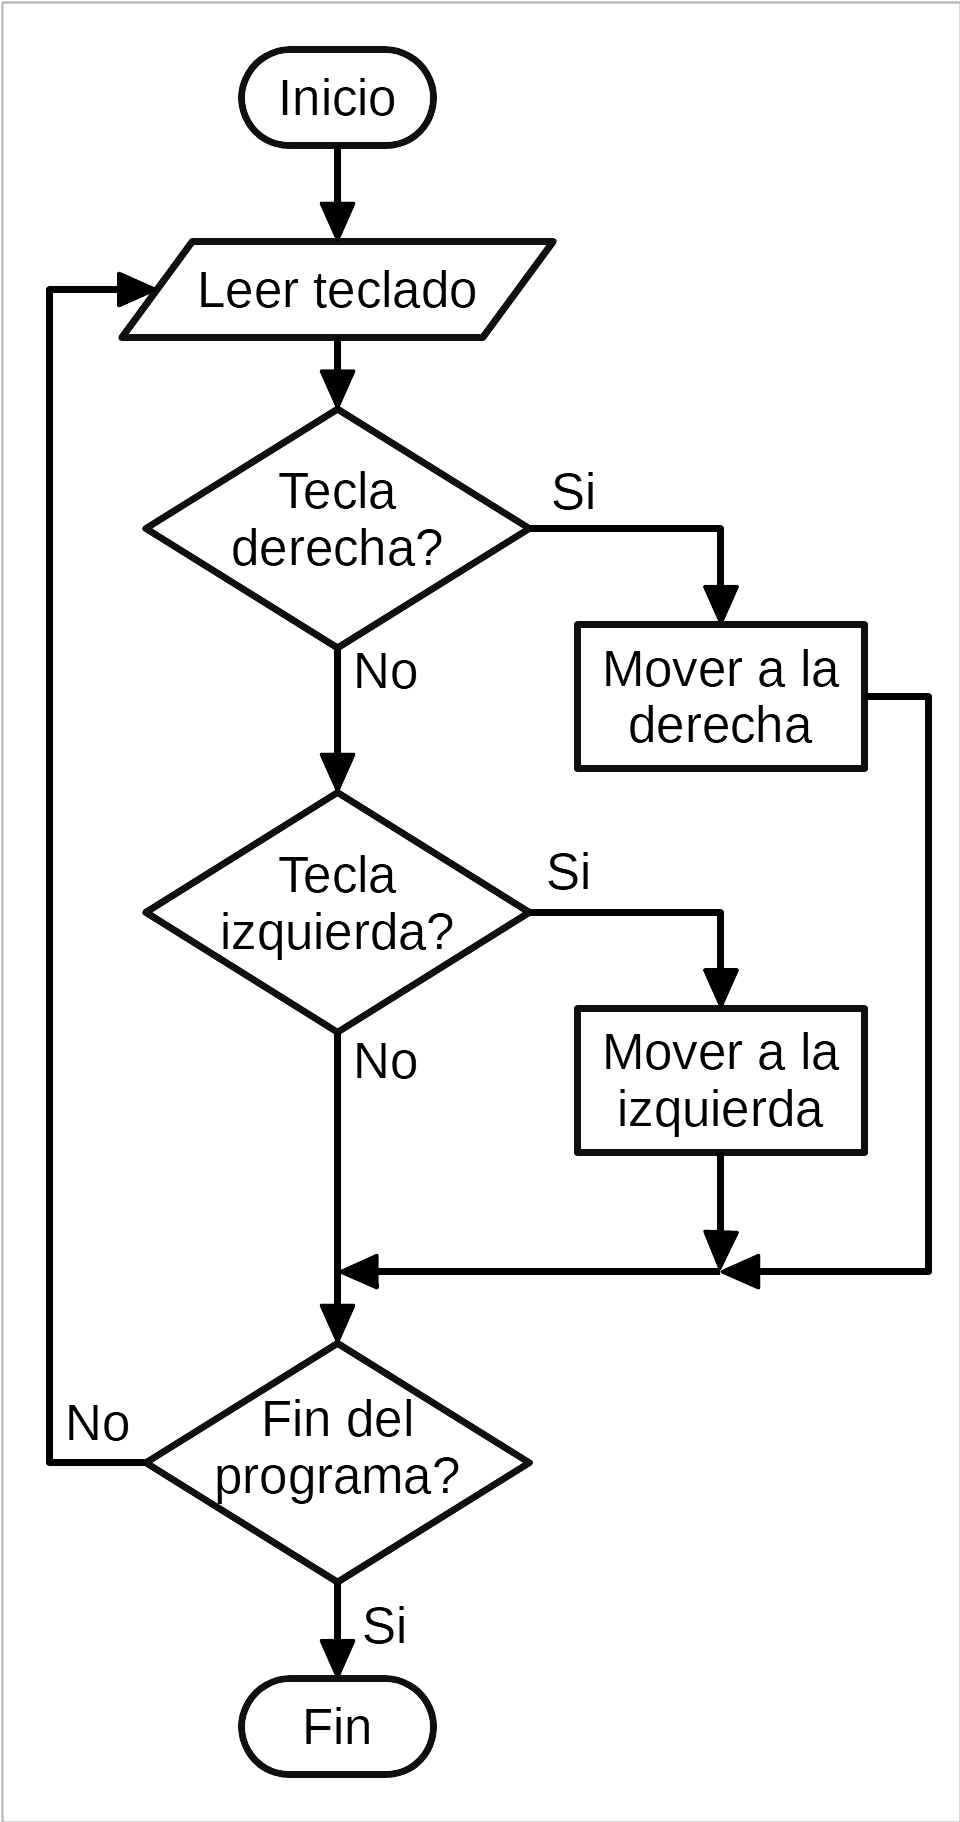
How to move a character with the keyboard.
Exercises
Draw a flow chart that describes the most important tasks you have to do in the mornings from the time you wake up until you arrive at school. There should be between 5 and 8 tasks.
Draw the flow chart to turn on the traffic light. First turn on the green light for 10 seconds, then turn off the green light and turn on an amber light for two seconds, then turn off the amber light and turn on a red light for 10 seconds. Finally, turn off the red light and end the cycle.
Draw a flow chart that represents the decision to turn on the heat. If the temperature is low, the heating will turn on. Otherwise nothing will be done.
Draw a flow chart that explains how to fix a lamp. You must first check if the lamp is connected. If it is not, we will connect the lamp. Then you will check that the bulb is not burned out. If it is blown you will change it. If no solution works, you will call the repair service.
Draw a flow chart that represents how to study a subject that has exercises. First we will study. Then we will do the exercises. If we solve the exercises correctly, we will finish studying. Otherwise, we will study again from the beginning.
Draw a flow chart to fix house defects. First check if a component moves. If it moves, but shouldn't move, secure it with duct tape. If it doesn't move but should move, add 3-in-1 oil. If it does what it's supposed to do, we won't fix anything.
Draw a flowchart describing the method for finding a card in a deck. First we ask what card we want to find. Then we will look for that card at the beginning of the deck of cards. If we find it, we're done. Otherwise we move the first card to the bottom of the deck and look for the card on the top of the deck again.
Draw a flowchart that describes a method for arranging the cards in a deck. There are two piles of letters, one disordered and one ordered. First you have to take a card from the disordered pile. It is then compared to the first card in the sorted pile. If the new card is smaller, it is placed on top of the sorted pile. If the new card is greater than the first sorted card, we look for the next card in the sorted pile and again compare which card is greater.
Once the new card is placed, we return to look for another card from the disordered pile. When the disordered pile of cards has no more cards, the program ends.
Draw a flowchart with your computer with the Libre Office Draw program. On the website you can download a Libre Office Draw template for drawing flowcharts.